


From HR data to decisions
Workforce Intelligence turns your headcount, attendance and payroll data into metrics, early warnings and explainable flight risk — and tells you what to do about it.
A leadership cockpit, not a chart library — every screen answers a decision. Drill from the whole org to a single employee in two clicks. The AI explains the numbers and recommends the next move; it never invents them.
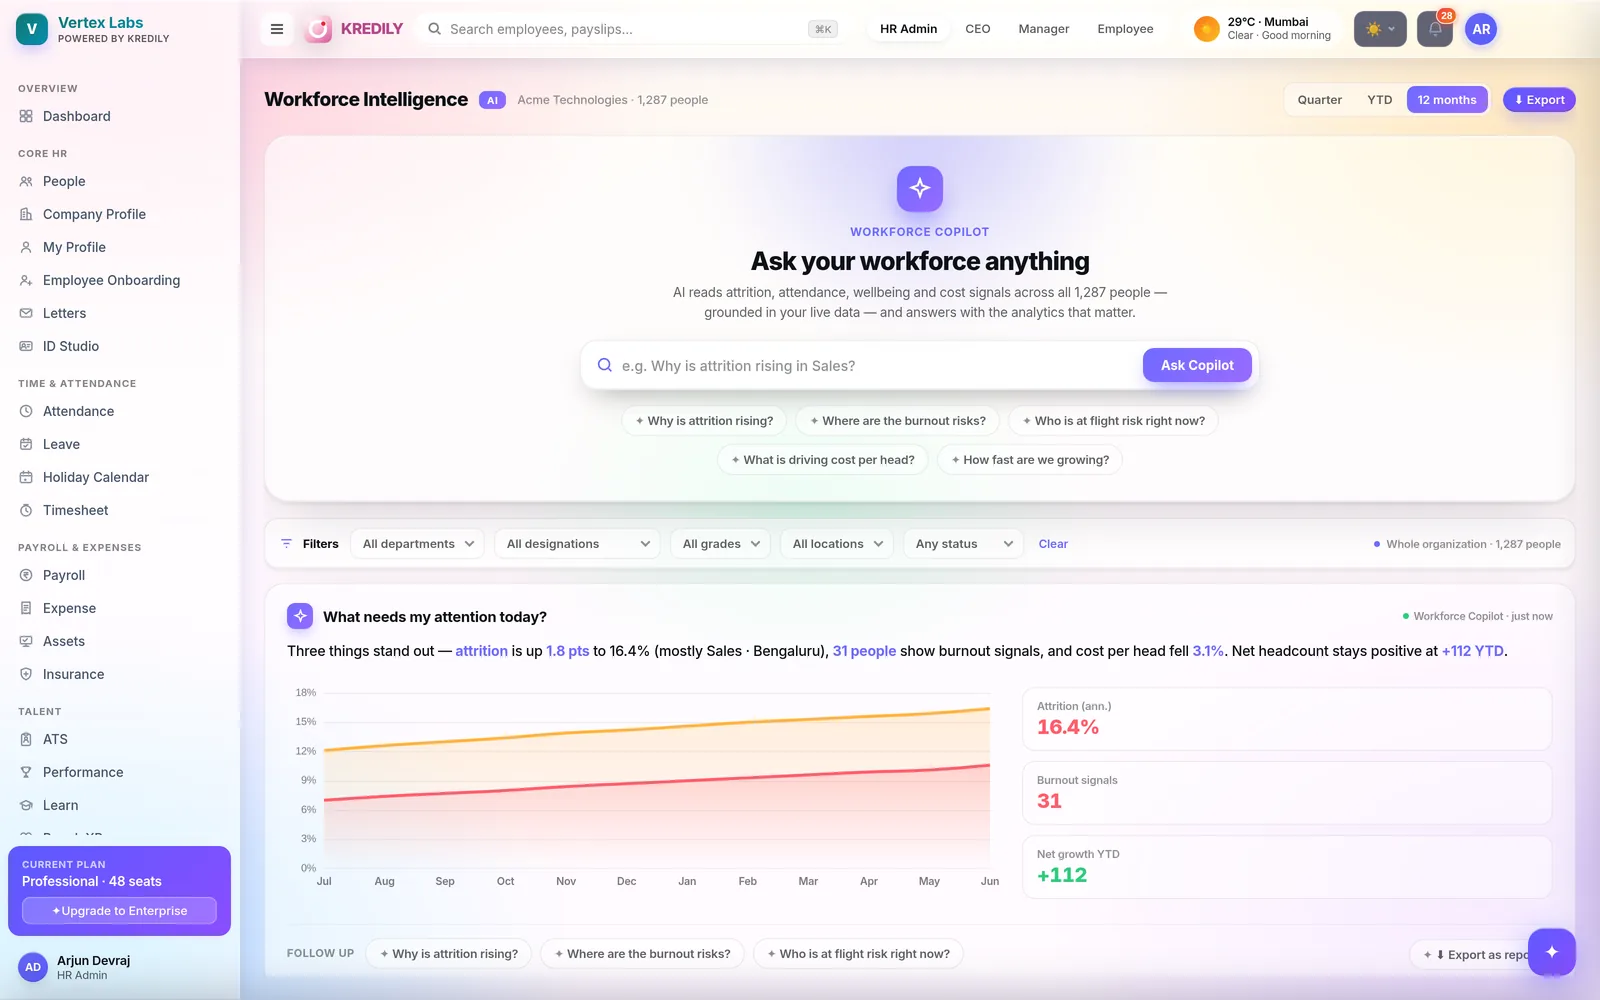
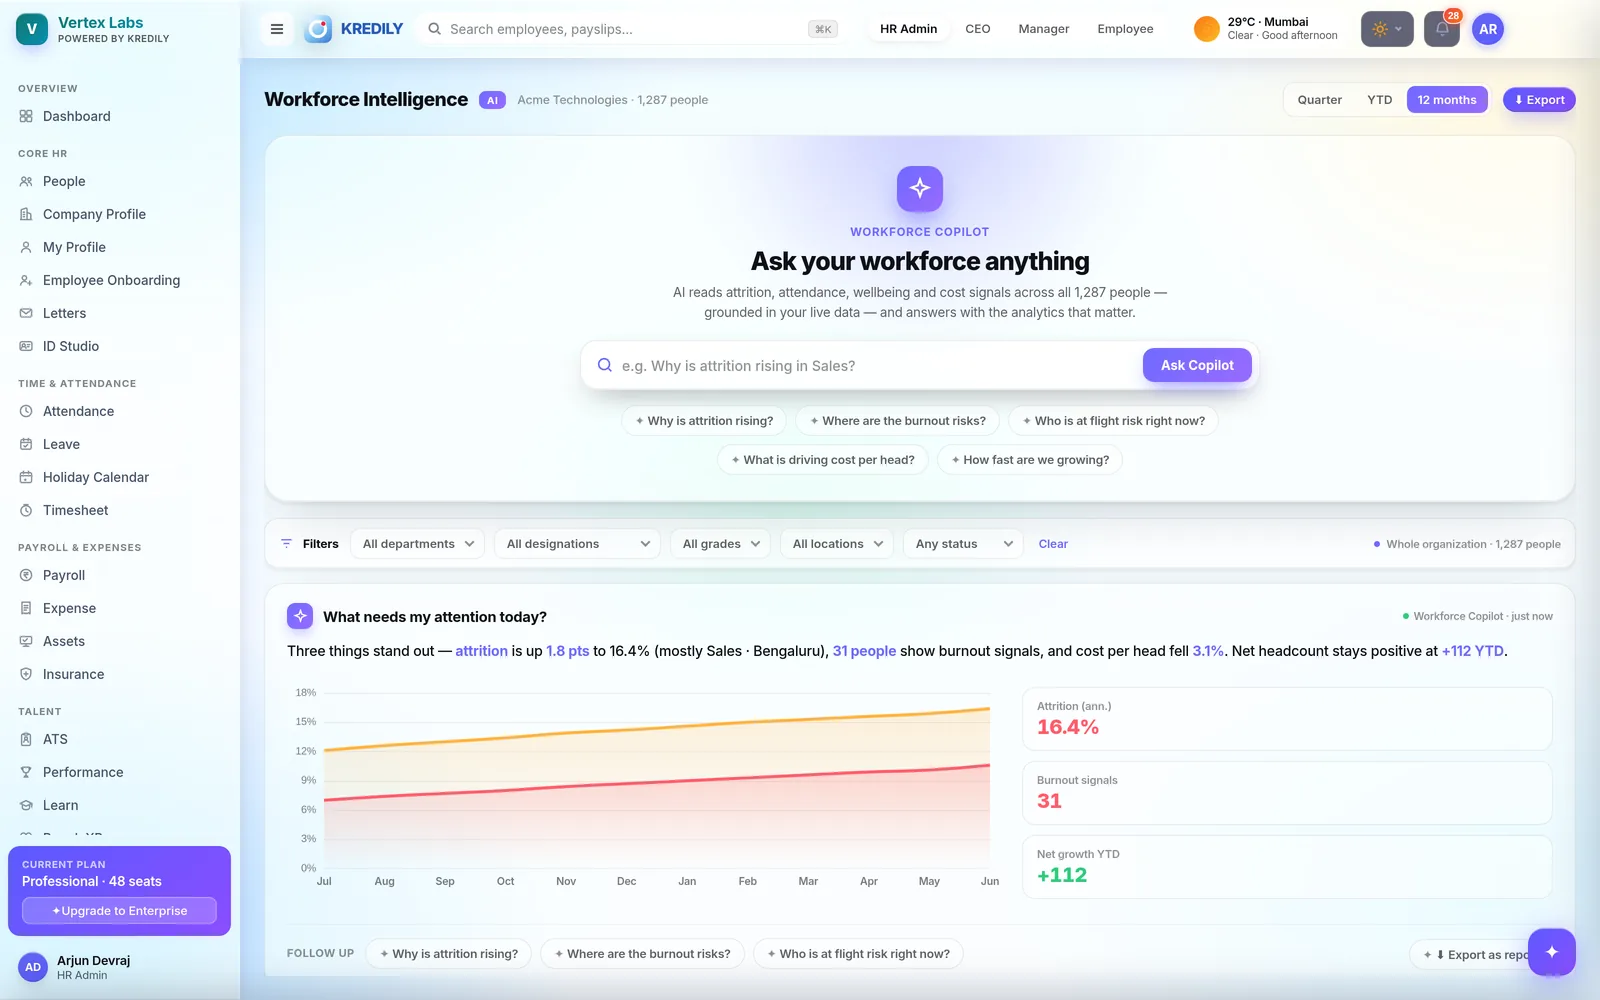
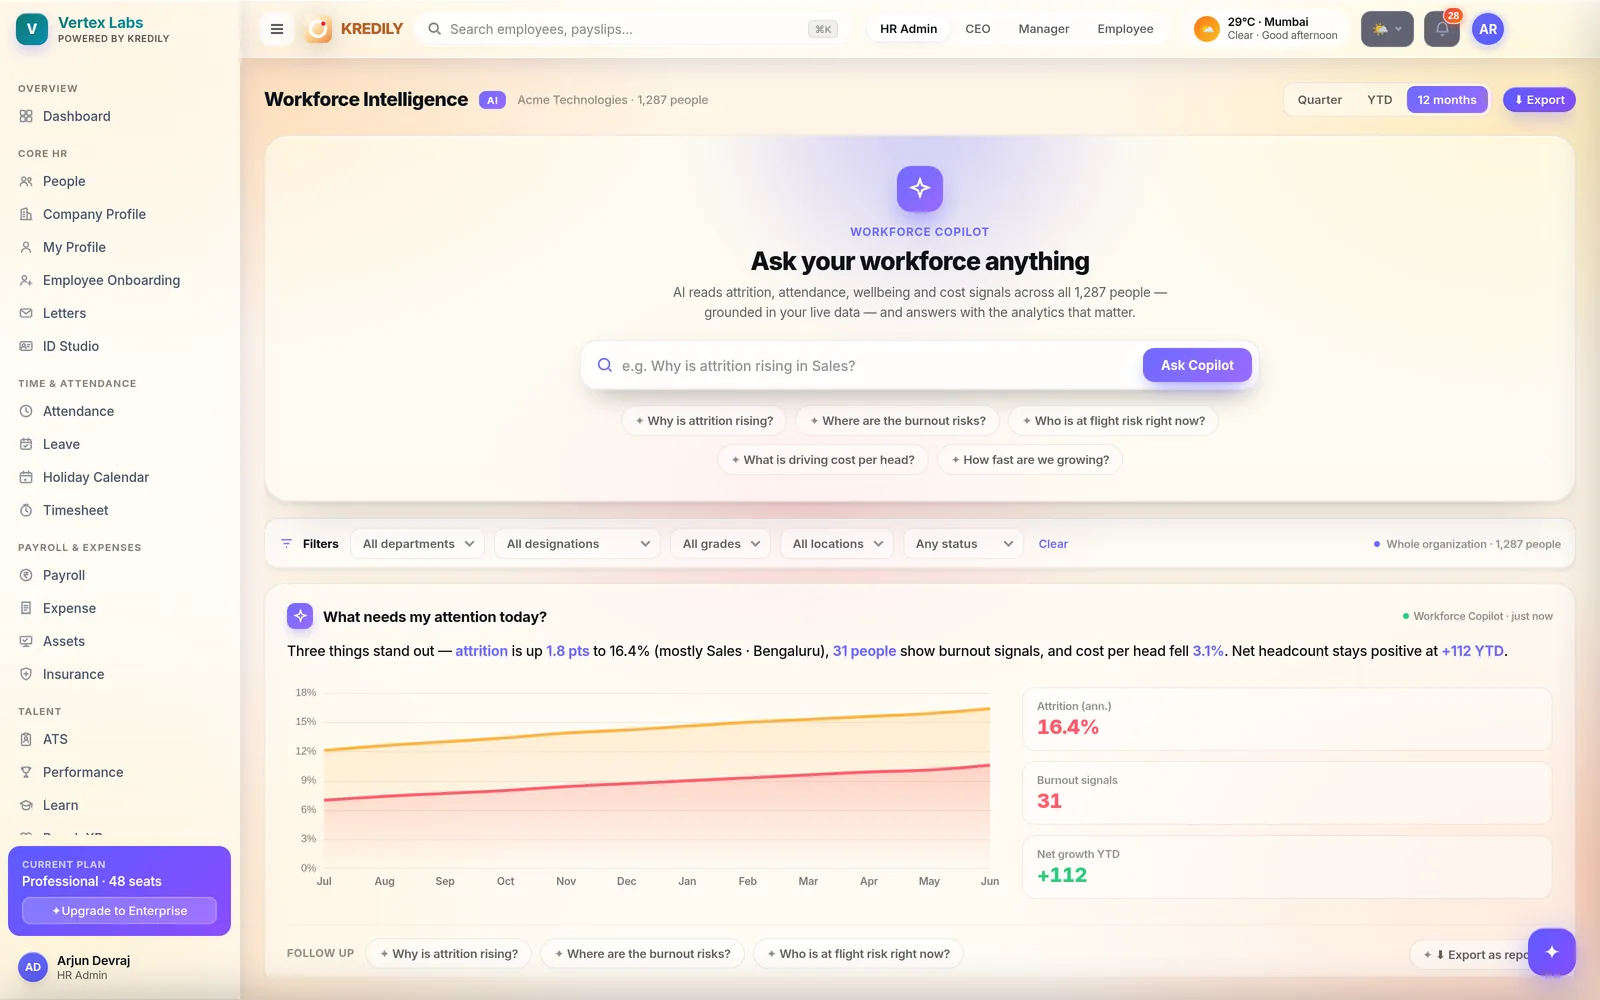
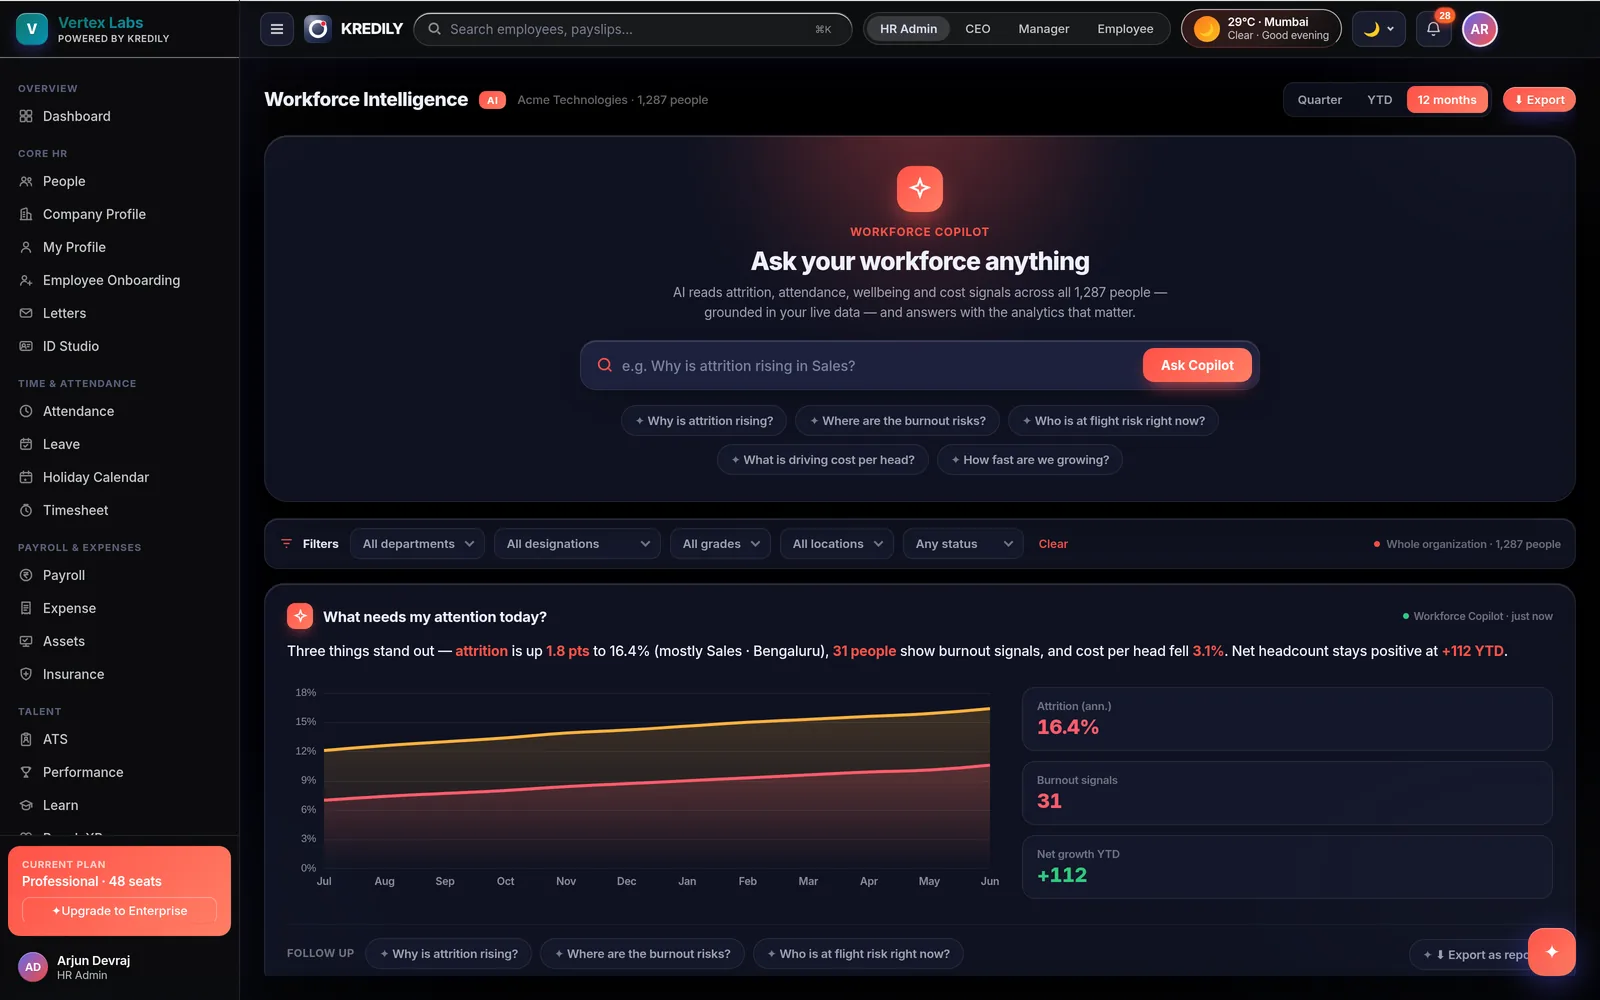
Ask your workforce anything
The cockpit opens with an ask bar, not a chart menu. Type the question a board member would ask — get the answer with its evidence.
Ask in plain language
“Why did attrition rise in Operations last quarter?” “Where is payroll cost growing fastest?” Suggested-question chips get you started; free text works too.
Get the answer with its evidence
A headline, the cross-module “why”, the matching chart, stat pills and concrete next actions — grounded entirely in your computed numbers. The AI explains; it never calculates.
Follow up, drill or hand off
Follow-up chips take you into the theme drill-down; every answer has “Export as report”. Questions beyond the curated set hand off to the AI Copilot.
Three levels deep, two clicks away
Most dashboards stop at the org chart-wall. WI drills from the company to the person — without losing your filters or your place.
L1 — The cockpit
One screen: KPI strip (headcount, net growth, attrition, flight risk, monthly cost, average tenure) with sparklines and deltas, the signals being watched, and the ask bar — over a Quarter / YTD / 12-month range.
L2 — The theme
Click any KPI, chart or signal to open a breadcrumbed drill-down: its own KPI strip, 3–5 charts and a table — an employee watchlist for attrition & wellbeing, a department breakdown for headcount & cost. Your filters carry down.
L3 — The employee
Click a watchlist row and a profile drawer slides in: flight-risk meter, the “why flagged” drivers, key signals, recommended actions — and “Open profile in Directory”. Close it and you’re back where you were.
Every people question lives in one of four drill-downs
Each theme is a full analysis surface — computed from your live Kredily data, broken down by department and tracked month over month.
Attrition & retention
Attrition rate, regrettable attrition, retention and tenure — plus per-employee flight risk from four explainable drivers: tenure, attendance pattern, pay-vs-grade-median and team attrition pressure. Flight risk is Enterprise, HR/leadership only, opt-in.
Headcount & growth
Headcount, net growth, hiring velocity vs exits, and the 12-month trajectory — sliced by department, grade and location, so “are we actually growing?” has one answer.
Wellbeing & attendance
Presence, punctuality, absenteeism and overtime per week — with a burnout signal you can read: fewer than 2 leave days taken plus 25+ overtime hours a week, sustained over 90 days. Burnout signal is Enterprise.
Cost & payroll
Payroll cost, cost per employee, department cost distribution and month-over-month movement — computed from actual runs and gated to finance & leadership eyes.
Slice everything, everywhere, at once
One filter bar re-scopes the whole cockpit — and follows you down every drill.
Five global filters
- Department · Designation · Grade (L1–L5 / Manager / Director)
- Location · Status (Active / Probation / On notice / On long leave)
- Live scope tag — e.g. “Senior Engineer · L3 · Active · ~38 people”
Scope follows you
- Selecting a filter re-scopes KPIs, trend charts and the open answer
- The scope carries into every theme drill-down
- One Clear resets everything
Right data, right eyes
- Leaders see company-wide; managers their team; employees themselves
- Cost data gated to finance & leadership
- Scored lists are HR/leadership only, opt-in, and access-logged
Four signals it raises before they cost you
WI connects data across modules and flags the issue with its evidence — early, while you can still act. Each signal opens the relevant theme.
Attrition risk spike
A department’s exits jump — corroborated by rising absenteeism.
Cost ↔ headcount divergence
Payroll cost growing faster than headcount — company-wide and per department.
Overtime-burnout risk
Overtime climbing while leave stays flat — a burnout warning, early.
Attendance-compliance drop
Absenteeism climbing above its recent baseline — flagged before it spreads.
Explainable by design
Intelligence is only useful if leaders believe it. Every number, insight and risk score shows its work.
The AI never calculates
All numbers come from the metric engine; the AI only explains and reasons over them.
No raw queries on your data
Questions become safe, structured lookups — never free-form queries against your records.
Everything is explainable
Every metric shows its numerator, denominator and sample size; every insight states its evidence; every risk score shows its drivers.
History & early warnings — not fortune-telling
WI tracks what happened and flags what’s drifting, with evidence. It never projects invented future numbers.
From cockpit to boardroom in one click
Everything you can see, you can take with you — in the format the audience expects.
PDF board deck
The Export menu turns the cockpit into a board-ready PDF deck — KPIs, trends and signals, no screenshot surgery.
Excel & CSV
Take the underlying tables to Excel or CSV for finance models and audits — the same computed numbers, nothing re-keyed.
“Export as report” everywhere
Every Ask WI answer and every theme drill-down exports as a report — the question, the evidence and the chart together.
Bridged to Reports
WI is where you explore and decide; the Reports hub is where you generate and download — the two link both ways.
Standard reports, ready to pull
A library of ready-made reports across every module — grouped into eight categories, each computed from your live data, not re-keyed into a spreadsheet.
Payroll & statutory
Pay Register, Salary / CTC Register and the Consolidated Net Pay report — plus the statutory files: Form 16, Form 24Q, PF ECR and ESI returns.
Attendance & leave
Consolidated attendance, presence and overtime, plus leave balances and utilisation — the numbers that feed loss-of-pay, straight out of the source.
People & cost
Directory and headcount composition, cost-per-employee, and the Attrition Analytics export — the org, decoded by department, grade and location.
Expense & compliance
Expense claims with the finance review queue and merchant analysis, plus the compliance register — every artifact export-ready for an audit.
Export in any format
Take any report as an Excel workbook, a board-ready PDF or raw CSV — the same computed numbers behind the cockpit, nothing re-typed.
AI-drafted custom report
Describe the report you need in plain language and the AI assembles it from your data — no drag-and-drop builder to learn. It drafts from what’s actually there; it never invents rows.
Every module reports into Workforce Intelligence
A six-card hub connects WI to the modules you already use — each with a headline insight, a jump into the module, and a WI deep-dive. Expense gets a dedicated Intelligence view with a finance review queue, fraud signals and merchant analysis.
Attendance
Absenteeism trend, presence and overtime — deep-dive into Wellbeing & attendance.
Leave
Leave utilisation and the burnout watch — who isn’t taking time off.
Payroll
Cost by department, regime split and cost-per-head — deep-dive into Cost & payroll.
Expense
Expense Intelligence: finance review queue, fraud signals, merchant analysis.
Directory
Org composition by department, grade and location — the denominator behind every metric.
Dashboard
The role-aware daily pulse — with WI one click deeper when a number needs a “why”.
No new data entry — ever
Uses data you already have
Pulls from your existing Kredily HR, attendance, leave and payroll data — nothing to import, no new data entry.
Refreshes on schedule
Metrics refresh each month after payroll closes; expense signals update continuously.
Runs on its own store
A dedicated analytics store does the heavy lifting, so intelligence never slows down the live app.
Every level sees what it needs
CEO / CHRO / Leadership
A company-wide cockpit: headcount, attrition, payroll cost, absenteeism, and connected insights that flag problems early.
HR leaders
Attrition & retention trends, attendance-compliance alerts, overtime-burnout warnings and per-employee flight risk.
Finance leaders
Payroll-cost trends, cost-per-employee, cost-vs-headcount divergence and expense intelligence.
Managers & employees
Managers see their own team’s metrics, scoped to their reportees; employees see their own numbers.
Workforce Intelligence questions, answered
Do I need to enter new data?
Can the AI invent numbers?
How deep can I drill?
How is “flight risk” calculated?
What is the burnout signal?
Who can see what?
Can I export it for a board meeting?
What happens if Ask WI can’t answer my question?
Which plan includes Workforce Intelligence?
What reports can I generate?
Explore the rest of the platform
Know what’s happening — before it costs you.
See your own headcount, attrition, cost and flight-risk cockpit, with every number explained.